The housing market wasn’t the only sector of the economy to experience a bubble earlier this decade. The commercial real estate market went through a bubble of its own. Take a look at the chart, below, which shows the
NAREIT price index for equity REIT’s.

A REIT is basically a real estate holding company. Provided that it distributes at least 90% of its earnings in the form of dividends, it is exempt from corporate income tax. The NAREIT index is an index of REIT prices, similar to the S&P 500 stock index.
REITs typically finance their investments with a mixture of debt and equity. Their share prices measure the market value of their equity, so they are imperfect proxies for the value of their underlying real estate holdings. On the other hand, because the shares are actively traded on public exchanges, the quoted prices provide a current snapshot of what’s going on in the commercial real estate market. (In contrast, popular housing market indicators such as the Case Shiller indexes are published only once a month, with a two-month lag.)
REIT prices rose by more than 100% over a four-year period beginning in 2003. Following the peak in early 2007, prices fell steadily for the next two years. During that period, REIT earnings actually increased at a healthy rate. Prices fell because investors were concerned that future earnings might be lower. In the fall of 2008, they were proved right in a spectacular way. Over the course of just nine months, earnings (and prices) fell by almost 50%. Take a look at the chart, below, which shows an index of dividends for the NAREIT index.

Dividends didn’t peak until mid-2008. Since then, they have fallen by 46%, and are now at their lowest level in more than 20 years. Remember, REITs are required to distribute at least 90% of their earnings in the form of dividends. So the decline in dividends will have been closely paralleled by a decline in earnings.
The dramatic fall in earnings suggests that REITs will have increasing difficulty servicing their debts. Here in the Bay Area, for instance, the
delinquency rate on commercial mortgages rose from 1% in the second quarter of 2008 to 4% in the second quarter of this year. Nationally, the
default rate on commercial mortgages rose from 1.2% in the second quarter of 2008 to 2.9% in the second quarter of this year. Forecasters are calling for a continued rise in the default rate, to around 4% by year’s end.
Even if REITs successfully meets their debt service requirements, they may still face serious financial problems as a result of declining earnings. Unlike residential mortgages, commercial mortgages typically have brief terms of only 5-10 years. When a commercial mortgage is due, it must be paid off in its entirety. The common solution is to obtain a new mortgage and use the proceeds to pay off the old one. If the value of the property has fallen, however, banks may refuse to lend as much as the borrower needs to pay off the old mortgage. In that event, the borrower may face foreclosure, even if he hasn’t missed a mortgage payment.
That’s the situation that owners of commercial real estate are facing now. I don’t have hard any numbers, but the press if full of
stories about borrowers in good standing who aren’t able to rollover the mortgages on their buildings. (In this respect, REITs are actually better off than most other owners of commercial real estate, since they generally use less leverage.) The result is likely to be an increased level of forced sales, which will put additional downward pressure on property values.
The NAREIT index touched bottom in February, and has risen 44% since then. As with the housing market, however, the recent bounce is primarily attributable to a collective sense of relief that the world isn’t descending into a second great depression. After all, REIT earnings are still falling rapidly, and the credit crunch hasn’t shown many signs of easing. Commercial real estate values are likely to be under pressure for some time to come.
 Sale prices didn't peak until the spring of 2007, but sale volumes started falling in 2004 (see this earlier blog entry). Stated in that way, the historical trajectory of the market may be difficult to grasp. The story becomes simpler, however, when prices and volumes are combined: After peaking at $8.0 billion in 2005, residential sales have fallen in every year since. Through the first eight months of 2009, sales are running at an annualized rate of only $3.6 billion. In percentage terms, that amounts to a 55% decline since the housing bubble burst.
 Capacity utilization is running at a 60-year low of 65.8%. That's 15 percentage points below the historical average of 80.9%. Manufacturing represents only about 12% of GDP, but considering the many other examples of idle capacity, I'd say that the Times story is right. It's likely to be quite awhile before unemployment falls appreciably.
 The blue bars show average sale prices for residential lots ranging from 1,500 to 4,500 square feet. (I used the average instead of the median because the average seemed to give a truer picture of what was happening to 'typical' lot values.) The dashed purple line shows median sale prices for single family homes. The four districts represented in the chart accounted for 86% of San Francisco's residential lot sales over the last fifteen years (i.e., as far back as my data goes).
 The series is volatile, but averages out to around $175,000 over the fifteen-year period represented in the chart. That's the value that the market is implicitly assigning to existing single-family structures.
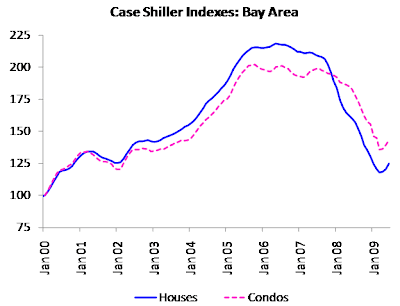 Case Shiller publishes its indexes with a two-month lag. If you don't want to wait that long,
 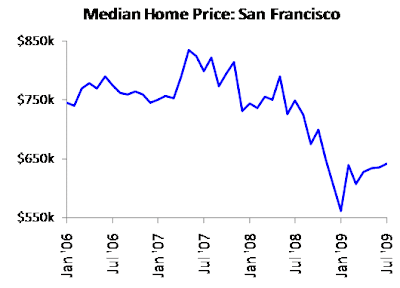 If you put any stock in median sale prices, the San Francisco market bottomed out in January, and has risen 14% since then.
 Most economists are expecting a slow, multi-year recovery in the job market. It would be nice to think that we've finally begun that recovery. If so, then Bay Area home prices may finally have hit bottom.